
Der ATTO Disk Benchmark ist eines der populärsten Tools zum Messen der Performance von magentischen Festplatten und taugt ebenso für den Einsatz bei modernen Solid State Drives, kurz SSDs. ATTO misst die Lese- und Schreibgeschwindigkeiten der Laufwerke unter Verwendung verschiedener Blockgrößen und deckt dabei Datenmengen von wenigen Kilobyte bis zu mehreren Megabyte ab. Daraus ergibt sich ein sehr breites Spektrum an Messwerten, die zur Bewertung der Leistungsfähigkeit eines Laufwerks herangezogen werden können. Für unsere Vergleichstests notieren wir die Übertragungsraten bei Blockgrößen von 4K, 32K, 128K sowie 8M, jeweils lesend und schreibend.
| 4K-Blöcke, Lesen, Mittelwert | |
| Samsung SSD 840 EVO, 1 TB | 299,16 |
| OCZ Vector 150, 480 GB | 257,00 |
| OCZ Vector 150, 120 GB | 256,62 |
| OCZ Vertex 460, 240 GB | 232,05 |
| Plextor M5 Pro Xtreme, 256 GB | 209,50 |
| OCZ Vertex 460, 480 GB | 202,88 |
| Plextor M6S, 256 GB | 202,87 |
| Plextor M5S, 256 GB | 180,30 |
| Plextor M5 Pro Xtreme, 128 GB | 169,03 |
| Intel SSD 335 Series, 240 GB | 140,33 |
| ADATA XPG SX900, 256 GB | 129,57 |
| Kingston HyperX 3K SSD, 120 GB | 129,25 |
| Kingston SSDNow V300, 120 GB | 123,83 |
| ADATA Premier Pro SP900, 256 GB | 123,43 |
| OCZ ARC 100, 240 GB | 121,80 |
| Crucial M500 SSD, 480 GB | 91,23 |
| Angaben in MB/sec (mehr ist besser) | |
| 4K-Blöcke, Schreiben, Mittelwert | |
| OCZ Vector 150, 120 GB | 286,87 |
| Crucial M500 SSD, 480 GB | 285,84 |
| OCZ Vector 150, 480 GB | 276,63 |
| OCZ Vertex 460, 240 GB | 259,05 |
| OCZ Vertex 460, 480 GB | 250,48 |
| Intel SSD 335 Series, 240 GB | 243,31 |
| Kingston SSDNow V300, 120 GB | 236,14 |
| ADATA Premier Pro SP900, 256 GB | 223,30 |
| Samsung SSD 840 EVO, 1 TB | 208,49 |
| ADATA XPG SX900, 256 GB | 203,89 |
| Kingston HyperX 3K SSD, 120 GB | 203,38 |
| OCZ ARC 100, 240 GB | 203,37 |
| Plextor M5 Pro Xtreme, 256 GB | 193,60 |
| Plextor M5 Pro Xtreme, 128 GB | 191,56 |
| Plextor M6S, 256 GB | 189,51 |
| Plextor M5S, 256 GB | 167,59 |
| Angaben in MB/sec (mehr ist besser) | |
| 32K-Blöcke, Lesen, Mittelwert | |
| Samsung SSD 840 EVO, 1 TB | 487,03 |
| OCZ ARC 100, 240 GB | 451,81 |
| Plextor M5 Pro Xtreme, 256 GB | 438,14 |
| Plextor M5 Pro Xtreme, 128 GB | 433,25 |
| Plextor M5S, 256 GB | 400,08 |
| Intel SSD 335 Series, 240 GB | 400,08 |
| Plextor M6S, 256 GB | 399,08 |
| ADATA XPG SX900, 256 GB | 389,96 |
| Crucial M500 SSD, 480 GB | 358,33 |
| Kingston HyperX 3K SSD, 120 GB | 357,44 |
| ADATA Premier Pro SP900, 256 GB | 353,06 |
| OCZ Vertex 460, 480 GB | 331,49 |
| Kingston SSDNow V300, 120 GB | 320,18 |
| OCZ Vertex 460, 240 GB | 286,56 |
| OCZ Vector 150, 480 GB | 282,00 |
| OCZ Vector 150, 120 GB | 248,00 |
| Angaben in MB/sec (mehr ist besser) | |
| 32K-Blöcke, Schreiben, Mittelwert | |
| ADATA Premier Pro SP900, 256 GB | 480,14 |
| ADATA XPG SX900, 256 GB | 476,76 |
| Kingston HyperX 3K SSD, 120 GB | 475,58 |
| Kingston SSDNow V300, 120 GB | 474,40 |
| Intel SSD 335 Series, 240 GB | 468,19 |
| OCZ Vertex 460, 240 GB | 456,57 |
| Samsung SSD 840 EVO, 1 TB | 452,09 |
| OCZ Vertex 460, 480 GB | 449,56 |
| OCZ Vector 150, 480 GB | 449,56 |
| OCZ Vector 150, 120 GB | 439,22 |
| OCZ ARC 100, 240 GB | 437,06 |
| Crucial M500 SSD, 480 GB | 437,06 |
| Plextor M6S, 256 GB | 353,06 |
| Plextor M5 Pro Xtreme, 256 GB | 350,18 |
| Plextor M5 Pro Xtreme, 128 GB | 323,35 |
| Plextor M5S, 256 GB | 293,01 |
| Angaben in MB/sec (mehr ist besser) | |
| 128K-Blöcke, Lesen, Mittelwert | |
| OCZ Vector 150, 480 GB | 551,71 |
| OCZ Vertex 460, 480 GB | 546,42 |
| Samsung SSD 840 EVO, 1 TB | 543,81 |
| Crucial M500 SSD, 480 GB | 541,22 |
| OCZ Vertex 460, 240 GB | 526,09 |
| Plextor M5 Pro Xtreme, 256 GB | 515,95 |
| Plextor M5 Pro Xtreme, 128 GB | 513,48 |
| Plextor M6S, 256 GB | 507,39 |
| Intel SSD 335 Series, 240 GB | 505,00 |
| Plextor M5S, 256 GB | 502,53 |
| OCZ Vector 150, 120 GB | 498,79 |
| ADATA Premier Pro SP900, 256 GB | 480,89 |
| ADATA XPG SX900, 256 GB | 476,33 |
| Kingston HyperX 3K SSD, 120 GB | 474,08 |
| Kingston SSDNow V300, 120 GB | 460,14 |
| OCZ ARC 100, 240 GB | 456,77 |
| Angaben in MB/sec (mehr ist besser) | |
| 128K-Blöcke, Schreiben, Mittelwert | |
| Samsung SSD 840 EVO, 1 TB | 532,63 |
| OCZ Vertex 460, 480 GB | 528,69 |
| OCZ Vector 150, 480 GB | 528,69 |
| OCZ Vertex 460, 240 GB | 527,39 |
| ADATA XPG SX900, 256 GB | 526,09 |
| ADATA Premier Pro SP900, 256 GB | 526,09 |
| Intel SSD 335 Series, 240 GB | 524,80 |
| Kingston HyperX 3K SSD, 120 GB | 523,52 |
| Kingston SSDNow V300, 120 GB | 517,20 |
| Crucial M500 SSD, 480 GB | 443,78 |
| OCZ Vector 150, 120 GB | 437,56 |
| Plextor M6S, 256 GB | 427,93 |
| Plextor M5 Pro Xtreme, 256 GB | 420,70 |
| Plextor M5S, 256 GB | 367,39 |
| OCZ ARC 100, 240 GB | 345,83 |
| Plextor M5 Pro Xtreme, 128 GB | 322,68 |
| Angaben in MB/sec (mehr ist besser) | |
| 8M-Blöcke, Lesen, Mittelwert | |
| OCZ Vector 150, 480 GB | 559,24 |
| Intel SSD 335 Series, 240 GB | 559,24 |
| ADATA Premier Pro SP900, 256 GB | 559,24 |
| ADATA XPG SX900, 256 GB | 557,95 |
| Kingston HyperX 3K SSD, 120 GB | 557,48 |
| OCZ Vector 150, 120 GB | 555,38 |
| Samsung SSD 840 EVO, 1 TB | 554,11 |
| OCZ Vertex 460, 240 GB | 554,11 |
| OCZ Vertex 460, 480 GB | 552,84 |
| Plextor M5 Pro Xtreme, 256 GB | 547,83 |
| Plextor M5 Pro Xtreme, 128 GB | 546,59 |
| Crucial M500 SSD, 480 GB | 539,27 |
| Plextor M5S, 256 GB | 531,56 |
| Kingston SSDNow V300, 120 GB | 526,33 |
| OCZ ARC 100, 240 GB | 485,86 |
| Plextor M6S, 256 GB | 444,22 |
| Angaben in MB/sec (mehr ist besser) | |
| 8M-Blöcke, Schreiben, Mittelwert | |
| Samsung SSD 840 EVO, 1 TB | 536,87 |
| OCZ Vector 150, 480 GB | 535,68 |
| ADATA XPG SX900, 256 GB | 534,50 |
| ADATA Premier Pro SP900, 256 GB | 534,50 |
| OCZ Vertex 460, 480 GB | 533,32 |
| OCZ Vertex 460, 240 GB | 533,32 |
| Intel SSD 335 Series, 240 GB | 533,32 |
| Kingston HyperX 3K SSD, 120 GB | 532,14 |
| Kingston SSDNow V300, 120 GB | 527,64 |
| Plextor M5 Pro Xtreme, 256 GB | 447,39 |
| Plextor M6S, 256 GB | 446,33 |
| Crucial M500 SSD, 480 GB | 444,22 |
| OCZ Vector 150, 120 GB | 438,01 |
| OCZ ARC 100, 240 GB | 429,99 |
| Plextor M5S, 256 GB | 400,65 |
| Plextor M5 Pro Xtreme, 128 GB | 319,57 |
| Angaben in MB/sec (mehr ist besser) | |
Für die FRITZ!Box 5690 Pro steht ab heute ein neues FRITZ! Labor zur Vorbereitung für das Release des FRITZ!OS 8.50...
In vielen Unternehmen war die Cloud in den vergangenen Jahren gesetzt – sei es für den Betrieb von Anwendungen oder...
Balkonkraftwerke mit Speicher können auch im Winter funktionieren, indem sie das verfügbare Tageslicht einfangen, Strom speichern und diese Energie mit...
Die meisten KI-Tools lösen genau ein Problem. Hier ein Bildgenerator, dort ein Videoersteller, woanders ein Werbetool. Ehe man sich versieht,...
Mit dem TEG-S708 erweitert TRENDnet sein Portfolio um einen unmanaged Multi-Gigabit-Switch mit acht RJ45-Ports und einer maximalen Übertragungsrate von 10...
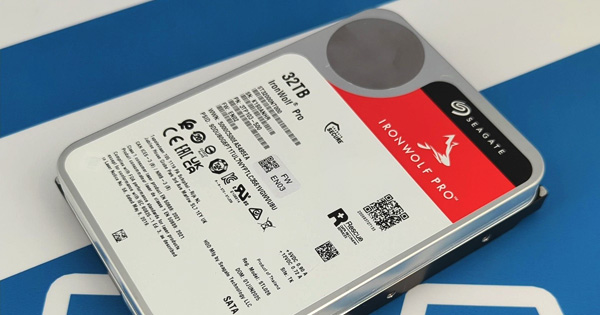
Die Familie der IronWolf Pro Festplatten von Hersteller Seagate adressiert vor allem NAS-Systeme im Profi-Segment. Wir haben uns das aktuelle Flaggschiff der CMR-Plattform mit satten 32 TB im Praxistest zur Brust genommen.
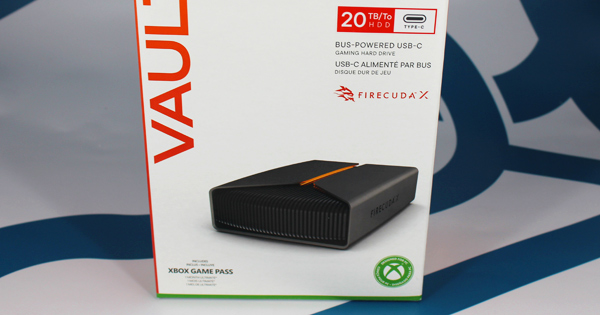
Mit der FireCuda X Vault präsentiert Seagate eine neue externe Festplatte, die vollständig über USB-C versorgt wird und bis zu satte 20 TB bietet. LED-Beleuchtung und ein passendes Toolkit runden das Gesamtpaket ab.
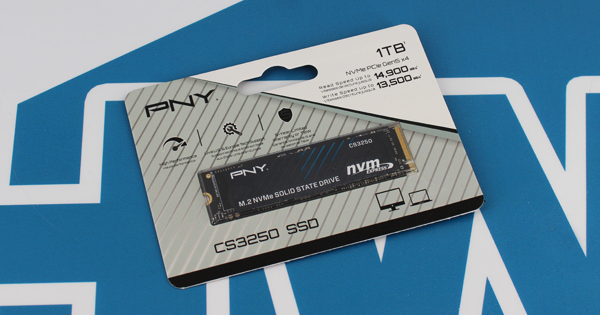
PNY bietet mit der CS3250 eine Familie von PCIe Gen5 SSDs an, die mit Speicherkapazitäten von bis zu 4 TB erhältlich sind. Die Drives erreichen bis zu 14.900 MB/s lesend. Wir haben das 1-TB-Modell getestet.